In 2024, a Gallup study found that 52% of voters rated the economy as an extremely important influence on their vote. This was the highest level since the Great Recession in 2008.
Choose a map to examine how growth, income, prices, and unemployment have changed across states since the pandemic.
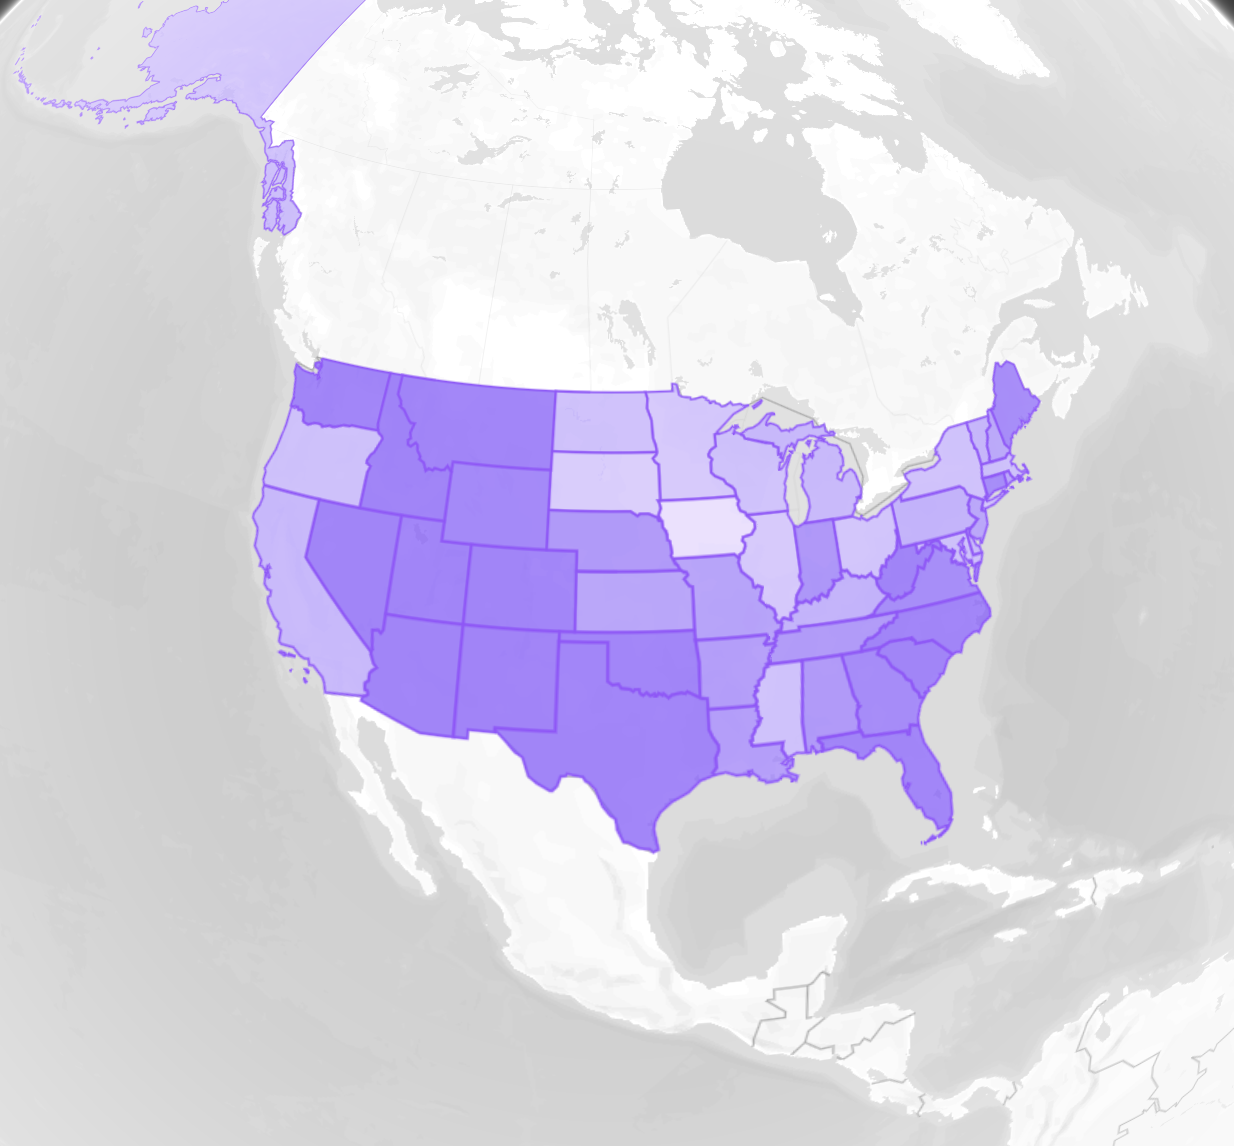
Real GDP Growth 2021–2024
Measures how much each state's economy has expanded from 2021 to 2024, adjusted for inflation. It reflects the true increase in the value of goods and services produced.

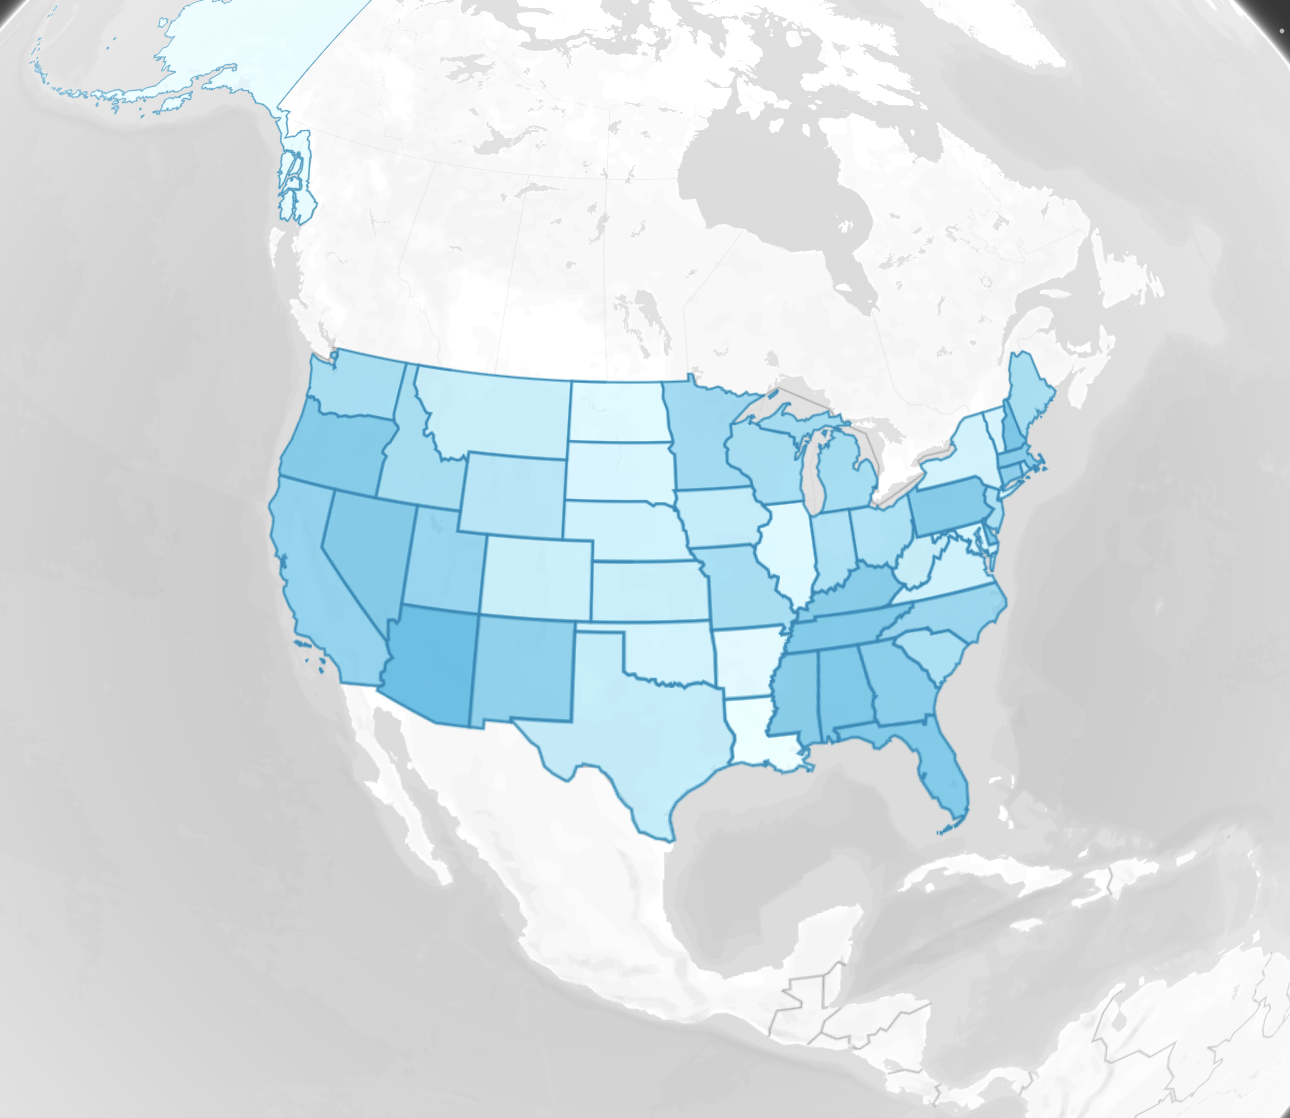
Per Capita Personal Income Change 2021–2024
Tracks how much income each person earned on average over time. It's useful for understanding individual economic well-being.
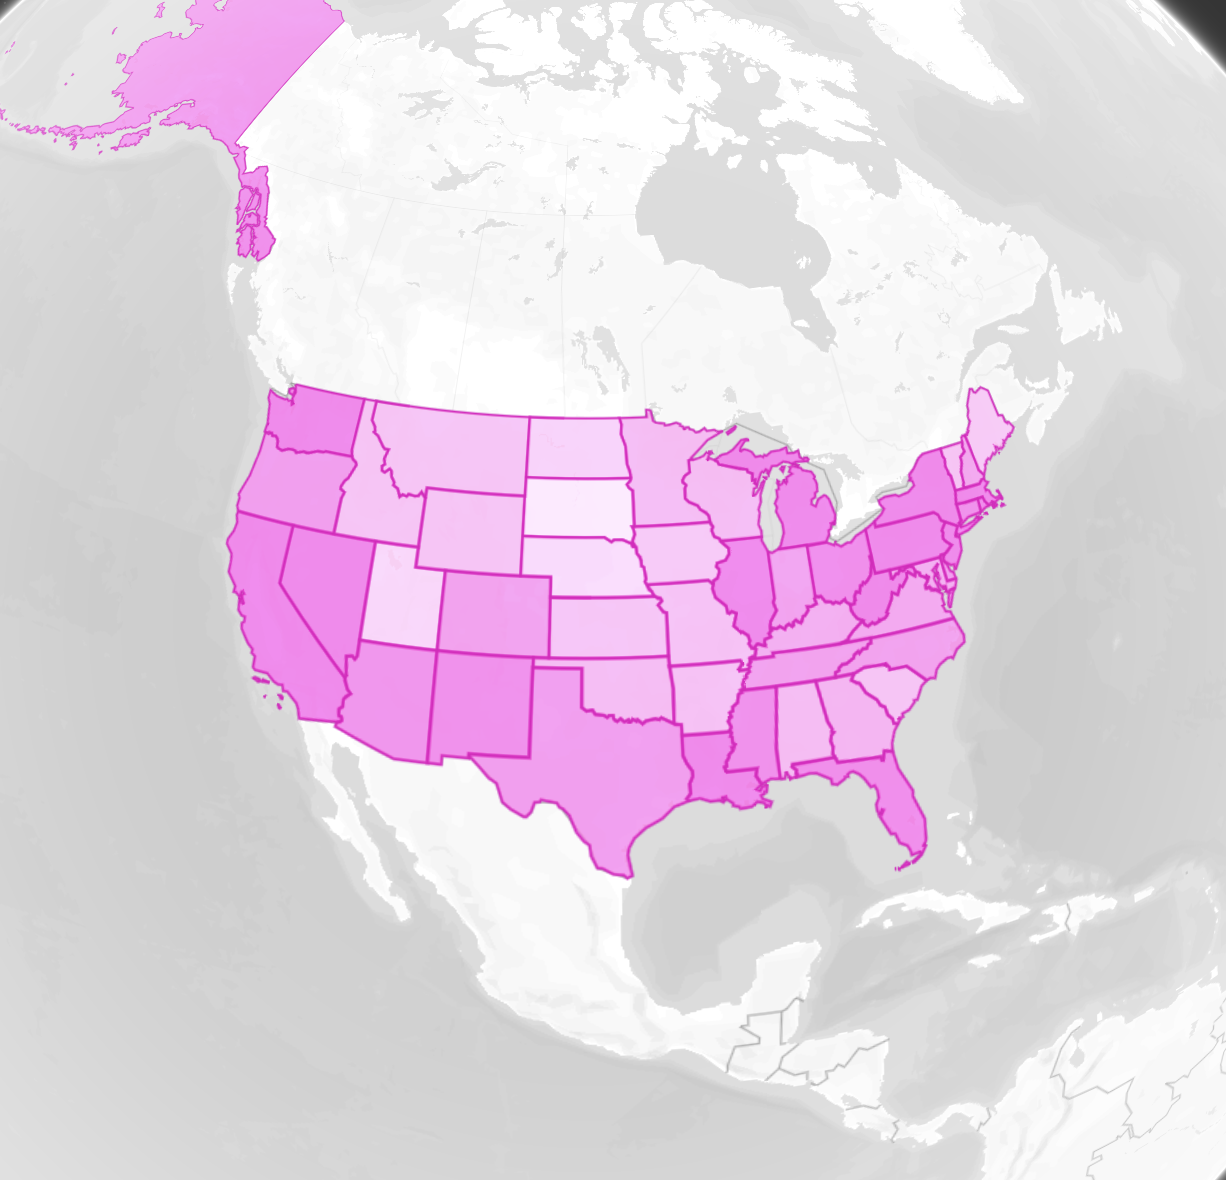
Regional Price Parity Change 2021–2023
Measures how much the cost of goods and services has changed in each state relative to the national average.
Unemployment 2024
Shows what percentage of the labor force is without a job but actively seeking work in 2024.
Measures how much each state's economy has expanded from 2021 to 2024, adjusted for inflation. It reflects the true increase in the value of goods and services produced.
2021-2024
Nov 2021 – Jan 2024
2021–2024